Seeing is believing!
Before you order, simply sign up for a free user account and in seconds you'll be experiencing the best in CFA exam preparation.
Basic Question 0 of 20
The following table represents the estimated returns for two motor vehicle production brands - ABC and XYZ, in 3 industrial environments: Strong (50% probability), average (30% probability) and weak (20% probability).
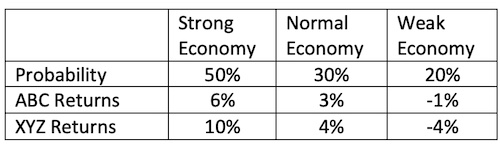
Given the above joint probability function, the covariance between ABC and XYZ returns is closest to:
User Contributed Comments 0
You need to log in first to add your comment.

Thanks again for your wonderful site ... it definitely made the difference.

Craig Baugh
Learning Outcome Statements
calculate and interpret the covariance and correlation of portfolio returns using a joint probability function for returns
CFA® 2026 Level I Curriculum, Volume 1, Module 5.