- CFA Exams
- 2024 Level I
- Topic 1. Quantitative Methods
- Learning Module 9. Parametric and Non-Parametric Tests of Independence
- Subject 1. Tests Concerning Correlation
Why should I choose AnalystNotes?
Simply put: AnalystNotes offers the best value and the best product available to help you pass your exams.
Subject 1. Tests Concerning Correlation PDF Download
Pearson's Correlation Coefficient
Pearson's correlation coefficient is a measure of the linear correlation (dependence) between two variables X and Y, giving a value between +1 and -1 inclusive, where 1 is total positive correlation, 0 is no correlation, and -1 is negative correlation. It tells us about the strength of the linear relationship between x and y points on a regression plot.
The correlation coefficient p measures the strength of a linear relationship in samples only. If we obtained a different sample, we would obtain a different correlation and therefore a potentially different conclusion. As always, we want to draw conclusions about populations, not just samples. To do so, we have to conduct a hypothesis test.
The hypothesis test lets us decide whether the value of the population correlation coefficient is "close to 0" or "significantly different from 0" based on the sample correlation coefficient r and the sample size n.
A t-test can be used to test the population correlation coefficient H0: p = 0.
Next, we calculate the value of the test statistic using the following formula:
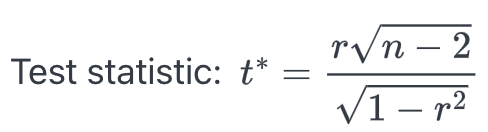
This is a t-statistic and operates in the same way as other t tests. Calculate the t-value and compare that with the critical value from the t-table at the appropriate degrees of freedom and the level of confidence you wish to maintain.
- If the calculated value is in the tail then cannot accept the null hypothesis that there is no linear relationship between these two independent random variables.
- If the calculated t-value is NOT in the tailed then cannot reject the null hypothesis that there is no linear relationship between the two variables.
Example
A financial analyst estimates the sample correlation between the US dollar and Canadian dollar monthly returns to be 0.4782 over the period of January 2020 to December 2021. At 5% significant level, would you reject the null hypothesis that the population correlation equals to 0?
There are 24 months. The test statistic t* = 0.4782 (24 - 2)1/2/(1-r2)1/2 = 2.55. Using the t-distribution table, the critical value is given by t0.025,22 = 2.074. Since the test statistic is larger than the critical value, we reject the null hypothesis.
A quick shorthand way to test correlations is the relationship between the sample size and the correlation. If |r| ≥ 2/√n, then this implies that the correlation between the two variables demonstrates that a linear relationship exists and is statistically significant at approximately the 0.05 level of significance. In the above example, 0.4782 > 2/241/2 = 0.4083, so the correlation coefficient is significantly larger than 0.
As the formula indicates, there is an inverse relationship between the sample size and the required correlation for significance of a linear relationship. With only 10 observations, the required correlation for significance is 0.6325, for 30 observations the required correlation for significance decreases to 0.3651 and at 100 observations the required level is only 0.2000.
The Spearman Rank Correlation Coefficient
One critical assumption is that the y values for any particular x value are normally distributed about the line. If they are not, we can use Spearman rank correlation coefficient, which is calculated on the ranks of two variables within their respective samples.
Spearman's correlation measures the strength of a monotonic relationship. Basically, this means that if one variable increases (or decreases), the other variable also increases (or decreases). It is a statistical measure of the strength of a monotonic relationship (whether linear or not) between paired data. Its interpretation is similar to that of Pearsons, e.g. the closer the r is to 1, the stronger the monotonic relationship.
User Contributed Comments 0
You need to log in first to add your comment.

I passed! I did not get a chance to tell you before the exam - but your site was excellent. I will definitely take it next year for Level II.

Tamara Schultz
My Own Flashcard
No flashcard found. Add a private flashcard for the subject.
Add